Regardless of your integration type, we offer an interactive UI to configure, troubleshoot, and understand the health of your integrations. We call this the Redox dashboard.


You must create a Redox account to log in to the Redox dashboard. Learn how to use the dashboard.
When you first log in, you’ll see a quick summary of what’s been going on in the selected environment over the last 72 hours.
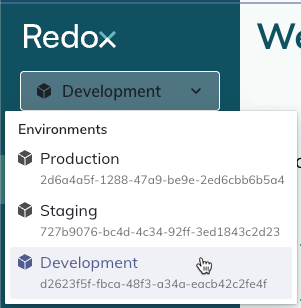
Keep in mind the homepage doesn’t show a summary of the entire Redox organization, but just one environment. Change the environment if you want to view a different summary.

Review at a glance how many connections and subscriptions are configured for the currently selected environment. Learn about connections.
Additionally, check how many logs have successfully processed and the percentage of how many have failed over the last 72 hours. Learn about logs.
See a list of the most recent failed logs. Up to 10 logs from the last 72 hours will display.
You can click on any of the entries in the list to review the specific log. Or you can click the View all link to open the Logs page showing all logs with a status of failed in the last 72 hours.
Check if any traffic alert rules are currently triggered. Learn how to create and link a traffic alert rule.
If there are any active triggered alerts, you can click on the entry in the list to review the specific alert rule. Or you can click the View all link to open the Monitoring page showing all configured alert rules in the environment.
As a heads up, the dashboard times out after 15 minutes of inactivity, whether you use single sign-on (SSO) or not. We implemented this timeout to meet HITRUST standards, which include specific requirements for timeout mechanisms. You must re-authenticate your session any time your session times out or is closed.